Know what a stock is worth before you buy
Scores from A to E for 30,000+ stocks and ETFs. Spot undervalued companies in seconds with fundamental analysis.

4.5+
App Store Rating
30,000+
Stocks & ETFs
Free
to Download
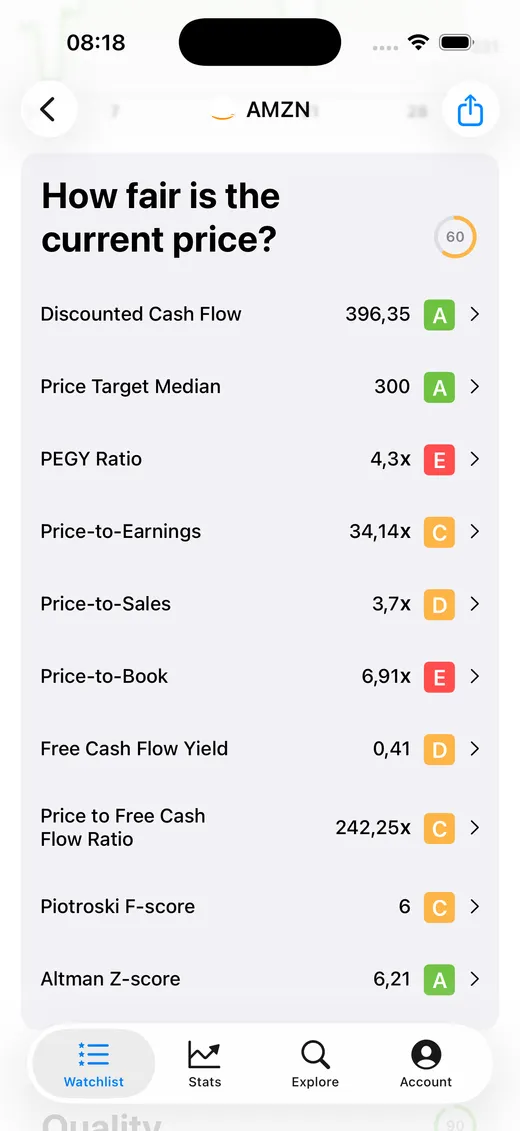
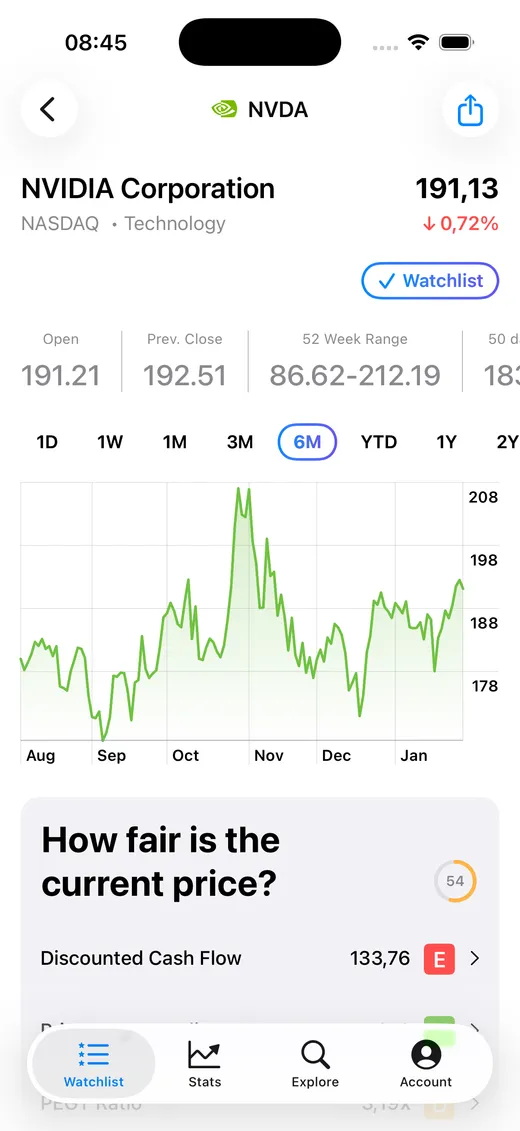
Paying $200 for a stock — but is it worth $200?
Most investors buy based on price charts and gut feeling. But price alone tells you nothing about value. A $200 stock can be a bargain — or a trap. You need fundamentals to know the difference.
Every ratio. Scored and explained.
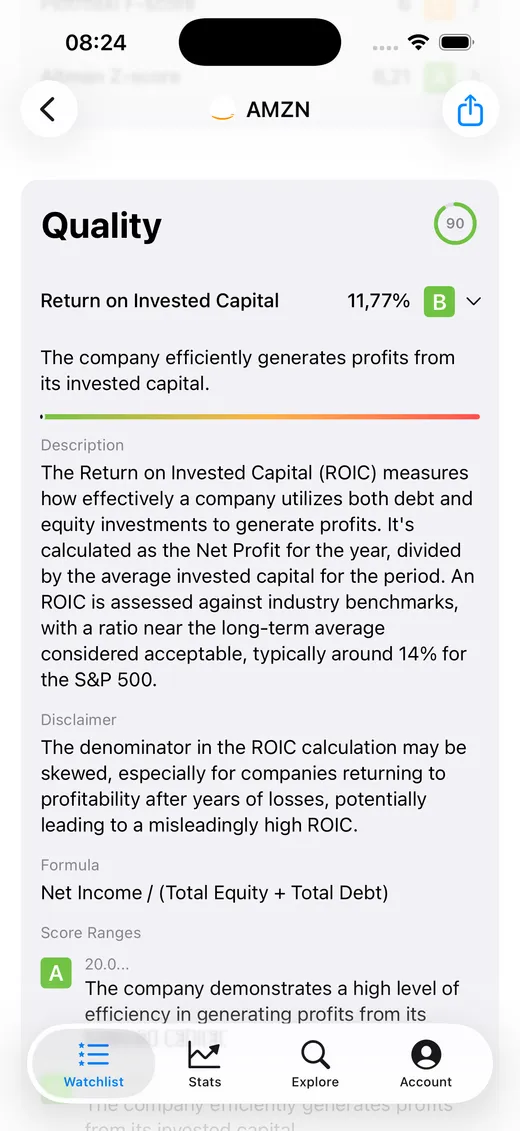
Stock Analyzer evaluates 19 fundamental criteria for every stock — and gives you a clear A through E rating for each one.
Instant stock scoring
Every fundamental ratio scored A through E. Green means the metric looks healthy. Red means proceed with caution. No financial degree required.
Plain-English explanations
DCF, PE, ROIC, Piotroski F-Score — each metric comes with a description of what it means, the formula behind it, and why it matters for your investment decision.
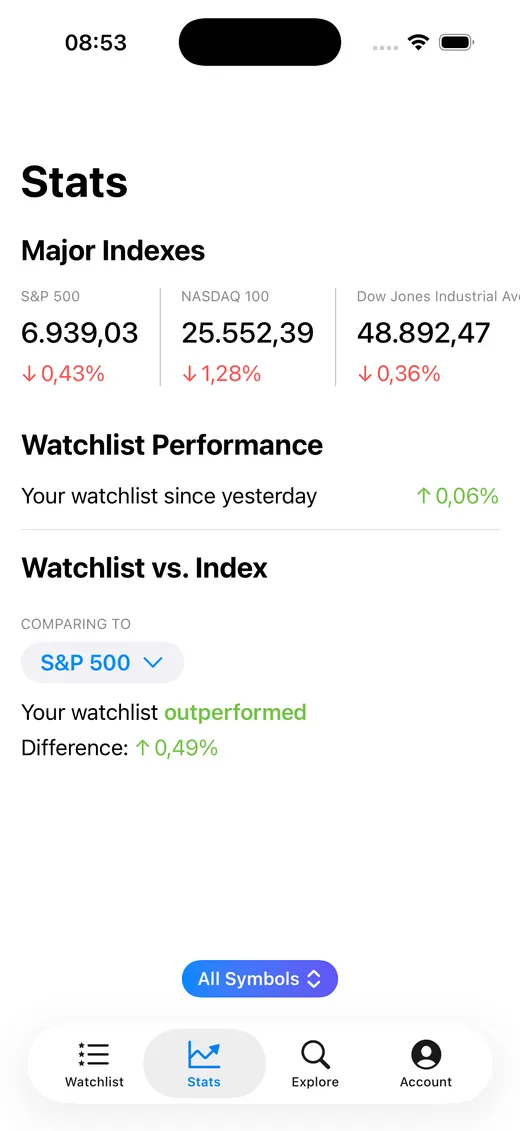
Compare your picks to the S&P 500
Track how your watchlist performs against major indexes. See daily movements for the S&P 500, NASDAQ, and Dow Jones — and whether your picks are keeping up.
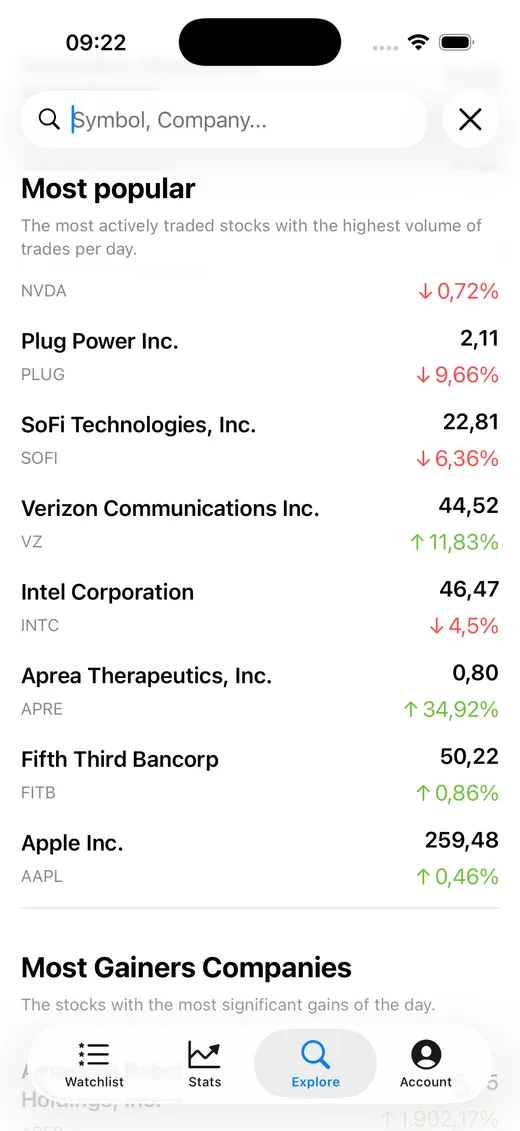
Discover what the market is watching
Explore the most popular and actively traded stocks of the day. See biggest gainers, losers, and trending symbols — then analyze their fundamentals with one tap.
Three steps to smarter investing
Search any stock
Type a ticker or company name. Over 30,000 stocks and ETFs are covered.
Read the scores
See A-E ratings for 19 fundamental criteria. Green is good. Red needs attention.
Decide with confidence
Make informed investment decisions backed by fundamental data — not gut feeling.
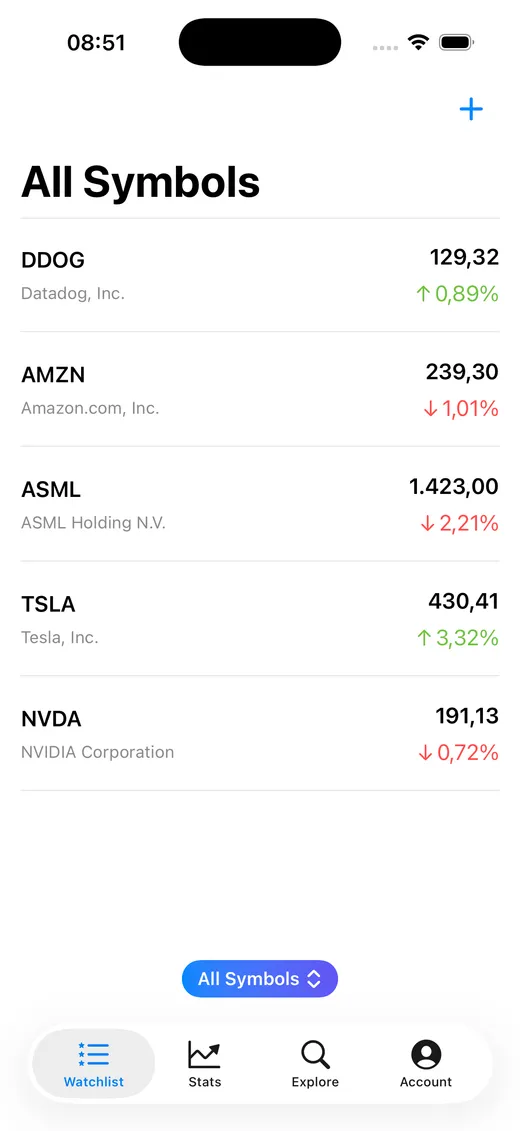
Trending stocks today
Pick a stock. See the score.
Frequently asked questions
Is Stock Analyzer free?
What fundamentals does it analyze?
How are the A-E scores calculated?
Does it support ETFs?
Is my data private?
Start analyzing stocks today
Free to download. No account required. Just search a stock and see the scores.